2019-10-11
Understanding filter context as sets of values
I recently came across a real head-scratcher of a
question
on Stack Overflow. This post is an expansion of the answer I gave
there. The goal is to provide a useful model to understand filter
context. This is foundational knowledge for any aspiring DAXter
(DAXist?) and is required to understand CALCULATE properly.
I will not copy the question in full and I encourage you to read it for context. I have excerpted and summarized the salient points below. The core challenge is to build a measure that interacts with a lot of date context - there are multiple date filters on visuals where the measure is being grouped by week and year.
The model
The model is simple, consisting only of 'FactSales' and 'Calendar'.
'Calendar': Note that this is the entirety of the table for our example. This is the first five days of 2019 and 2020. In a larger model, we would expect full years of dates.
DateKey Year Week Holiday 2019-01-01 2019 1 TRUE 2019-01-02 2019 1 FALSE 2019-01-03 2019 1 FALSE 2019-01-04 2019 2 FALSE 2019-01-05 2019 2 FALSE 2020-01-01 2020 1 TRUE 2020-01-02 2020 1 FALSE 2020-01-03 2020 1 FALSE 2020-01-04 2020 2 FALSE 2020-01-05 2020 2 FALSE 'FactSales': Note that we have one row of data per date in 'Calendar' and that each row has the same value for 'FactSales'[Sales], 100.
Sales DateKey 100 2019-01-01 100 2019-01-02 100 2019-01-03 100 2019-01-04 100 2019-01-05 100 2020-01-01 100 2020-01-02 100 2020-01-03 100 2020-01-04 100 2020-01-05
There is one relationship:
- 'Calendar'[DateKey] -1:N-> 'FactSales'[DateKey]
The problem
The challenge is to write a measure, [AllSales], which fulfills the requirements below.
[AllSales] should:
- respect 'Calendar'[DateKey] filter
- ignore all 'Calendar'[Holiday] filters
- work when used in visuals with 'Calendar'[Year] and 'Calendar'[Week] as grouping columns
Essentially, [AllSales] is for use in visualizing sales inclusive of
holidays. It is used alongside another measure, Sales = SUM ( 'FactSales'[Sales] ) for comparison purposes.
The measure is used in visuals with fisual level filters:
'Calendar'[DateKey] > 2019-01-03(exclude week 1 of 2019)'Calendar'[Holiday] = FALSE
The visual level filter on 'Calendar'[DateKey] appears to have been
chosen, because Power BI does not allow you to easily express a filter
on a specific week when more than one year is in context. I.e. if
setting a filter for 'Calendar'[Week] <> 1, that would exclude the
first week in both years, not just in 2019. Power BI filters do not
support arbitrary combinations that would allow us to include 2020
week 1, but not include 2019 week 1.
Here are some numbers to keep in mind as we explore the behavior of this measure:
| Scenario | Sales |
|---|---|
| All dates | 1,000 |
| All dates after 2019-01-03 | 700 |
| All non-holidays after 2019-01-03 | 600 |
| 2019 total | 500 |
| 2020 total | 500 |
The original measure in the question is shown below. I encourage you to think about how you'd write this measure and how you think it will behave with the filters described above.
AllSales =CALCULATE (SUM ( FactSales[Sales] ),ALL ( 'Calendar'[Holiday] ),ALL ( 'Calendar'[DateKey] ))
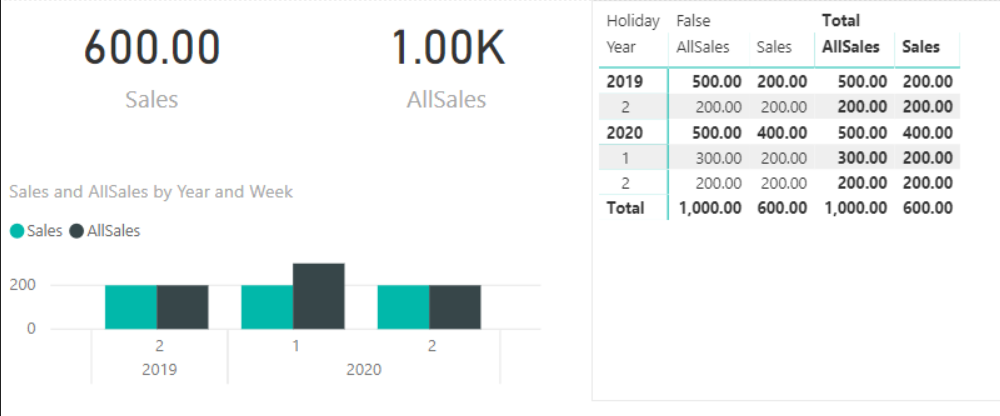
With all this in mind, take a gander at this report sample. Note that the 2019 subtotal is 500 (not respecting the visual-level filter for dates after 2019-01-03), and that the grand total is 1,000 rather than the desired 700.
At this point, I bet you have an opinion and you're saying, "Hey,
Greg, the problem is just that extra ALL on line 5. Just delete that
little guy and all will be well. Stop wasting my time with this wordy
post." That was my first thought as well. I invite you to try on your
own and observe the problem that the StackOverflow poster ran into,
and which caused me to begin doubting that I actually know anything at
all about DAX. Without line 5, ALL ( 'Calendar'[DateKey] ), the
measure returns only non-holiday sales, despite line 4's ALL ( 'Calendar'[Holiday] ). You can refactor to different forms of ALL
or other functions in the family. This problem, as presented, seems
nearly intractable, despite flying in the face of how your intuition
should work about DAX (because obviously your intuition should mirror
mine).
What's happening?
As we know, all interactions in Power BI and other similar client tools generate queries for the data engine. I've excerpted the head of the query for the matrix in the sample report. This is not the full query, but it is enough for us to understand what is going on.
Nota bene: The query below is a pattern specific to Power BI visuals. Other client tools can and do use different query patterns. For the most part you can assume that Power BI will generate queries that look largely like this for visuals.
DEFINEVAR __DS0FilterTable =FILTER (KEEPFILTERS ( VALUES ( 'Calendar'[DateKey] ) ),'Calendar'[DateKey] >= ( DATE ( 2019, 1, 3 ) + TIME ( 0, 0, 1 ) ))VAR __DS0FilterTable2 =TREATAS ( { FALSE, BLANK () }, 'Calendar'[Holiday] )VAR __DS0Core =SUMMARIZECOLUMNS (ROLLUPADDISSUBTOTAL ('Calendar'[Year], "IsGrandTotalRowTotal",'Calendar'[Week], "IsDM1Total"),__DS0FilterTable,__DS0FilterTable2,"Sales_Amount", 'FactSales'[Sales Amount],"All_Sales", 'FactSales'[All Sales],)...
If you've never dug into the DAX queries created by Power BI, here's
your crash course. Any filtering will be reflected in table variables
named in the pattern of __DS0FilterTableN, as you can see on lines
2-6 and 8-9. These are then used as filter arguments to a
SUMMARIZECOLUMNS. The SUMMARIZECOLUMNS will have as grouping
columns (its first arguments, before the filter tables) whatever
fields are used in the Power BI visual. The grouping columns and the
filter arguments contribute to filter context for the measures
referenced in the final arguments.
There will often be more logic in the query following the
SUMMARIZECOLUMNS, which is primarily used to help Power BI plot the
data correctly. The core logic and measure evaluation is done in the
section I've excerpted, though. This is reflected in the VAR name,
__DS0Core - it is the core data to be plotted.
The filter tables might represent any of the following:
- Visual level filters (as they do in our example)
- Page level filters (including drill-through filters)
- Report level filters
- Slicer selections
- Cross-filtering from other visuals
It doesn't much matter what element in Power BI is responsible for creating the filter context. All of these things get logically merged together. We'll explore this in detail in the next section. If you've spotted what is going on here, you're way ahead of where I was when I was trying to reason through this.
Filter context is literally a set of included values
This is an often overlooked or underappreciated nuance in DAX, but I'm
not sure which. When we use the word "filter" in English, we often
mean that we are discarding something. For example, filtered water is
water that has all the bad stuff taken out. Indeed, the FILTER DAX
function is often used to exclude values, and we use this type of
negative phrasing. This can cause confusion. Take the sample of the
date filter in our query. We may easily phrase this as, "I want to
exclude the first week of 2019," and no one would look askance at
us. We might say the FILTER function there is removing the first
week of 2019 from context, and again no one would bat an eye. This
negative phrasing does not accurately represent what is happening.
What literally happens is that we create a set of values we wish to include. The values in 'Calendar'[DateKey] absent any other filter context are:
{ 2019-01-01, 2019-01-02, 2019-01-03, 2019-01-04, 2019-01-05,2020-01-01, 2020-01-02, 2020-01-03, 2020-01-04, 2020-01-05}
When we evaluate the snippet below:
FILTER (KEEPFILTERS ( VALUES ( 'Calendar'[DateKey] ) ),'Calendar'[DateKey] >= ( DATE ( 2019, 1, 3 ) + TIME ( 0, 0, 1 ) ))
we are left with a filter context on 'Calendar'[DateKey] of:
{ 2019-01-04, 2019-01-05,2020-01-01, 2020-01-02, 2020-01-03, 2020-01-04, 2020-01-05}
We can always understand a filter context as literally a set of values
which shall be included when evaluating some expression. Any phrasing
that suggests removal or exclusion is merely a useful shorthand for
the idea of constructing a set of values for inclusion. This should
also help make sense of why ALL is so named. We often refer to ALL
as "removing filters" from columns or tables, but it can be better
understood as "including all values from a column or table."
Rather than using the verbose "set of included values", we can refer to a "slice" of data. Hey, that sounds a bit like a concept we're familiar with. Slicers set filter context by allowing you to select a slice of the column values; this is synonymous with, "Slicers allow you to select a set of included values." Note, a slice may be the set of all values in the column. Clearly, someone was thinking about all this when designing these things we use daily - that's comforting.
Dissecting our query
With the understanding of filter context above, we're ready to dive into the hard part of this question.
We often discuss filter contexts being combined with a logical
and. This is often good enough, but as we discussed above, a filter
context is best understood as a literal set of values. Sets don't
combine via logical operators. The set equivalent of a logical and
is intersection, and we should use this term to help understand what's
happening. (Note that in nested CALCULATEs multiple layers of filter
context exist - all of these layers are not intersected. This is
beyond the scope of this post, but I'll likely handle that topic in
the future.)
Many client tools for the Tabular engine preserve correlations among slices from the same table. This means that when you plot two columns from the same table on a single visual or pivot, you only see the values that correlate. You don't get a crossjoin, like you would when plotting slices from two different tables. You can see this behavior in Excel pivot tables and Power BI visuals. This decision doesn't often cause confusion - preserving correlations between items with known correlations seems obvious.
On the flip side, there is often confusion among first-time users when creating a new visual (e.g. a Power BI table, or an Excel pivot table) with two fields from different data tables. In the absence of a measure, this visual will show a crossjoin of the values from each field (or slices of the fields in the presence of filter contexts).
Because the client tools preserve these correlations, it is an
optimization in SUMMARIZECOLUMNS that slices from a single table are
merged into a single filter context. This means that our two separate
filter tables, __DS0FilterTable ('Calendar'[DateKey]) and
__DS0FilterTable2 ('Calendar'[Holiday]), are merged into a single
filter context. Note that this is an optimization specific to
SUMMARIZECOLUMNS, and other queries will not necessarily perform
identically. The description of filter contexts in this post is
universal, but the merging of correlated slices is specific to
SUMMARIZECOLUMNS, and therefore specific to Power BI (or other
client tools using this function in their queries).
Explicitly, we do not have two separate filter contexts:
- 'Calendar'[Holiday]
{ FALSE } - 'Calendar'[DateKey]
{ 2019-01-04, 2019-01-05,2020-01-01, 2020-01-02, 2020-01-03, 2020-01-04, 2020-01-05}
Instead, we have a single filter context made up of the intersection of these two. This is best represented not as a set, but as a table:
| 'Calendar'[Holiday] | 'Calendar'[DateKey] |
|---|---|
| FALSE | 2019-01-04 |
| FALSE | 2019-01-05 |
| FALSE | 2020-01-02 |
| FALSE | 2020-01-03 |
| FALSE | 2020-01-04 |
| FALSE | 2020-01-05 |
Note that this filter context does not include 2020-01-01, a holiday, because we have intersected the values that align with both separate filters. 2020-01-01 is after 2019-01-03, but is a holiday. By merging these separate filter contexts, we only have non-holiday 'Calendar'[DateKey]s in context.
That's the filter context in which we evaluate our measure, [AllSales].
AllSales =CALCULATE (SUM ( 'FactSales'[Sales] ),ALL ( 'Calendar'[Holiday] ),ALL ( 'Calendar'[DateKey] ))
The alternative below cannot include 2020-01-01:
AllSales =CALCULATE (SUM ( 'FactSales'[Sales] ),ALL ( 'Calendar'[Holiday] ))
Why can it not? Well, our filter context includes only the following 'Calendar'[DateKey]s:
{ 2019-01-04, 2019-01-05,2020-01-02, 2020-01-03, 2020-01-04, 2020-01-05}
That context has already been derived. ALL ( 'Calendar'[Holiday] )
can only affect the slice on 'Calendar'[Holiday]. Thus, the original
question asker added the ALL ( 'Calendar'[DateKey] ) to get
2020-01-01 back into the context. This works fine in 2020, because all
of the dates just so happen to be after the first week of 2019. It
also works fine for the second week of 2019, as those also fall after
the first week of 2019. (It may seem I am stating painfully obvious
things, but these are obvious only based on our understanding of the
calendar. DAX has no such understanding. To DAX, these are just dumb
values that happen to have a sort order.) Unfortunately, when we
evaluate the 2019 subtotal, that ALL ( 'Calendar'[DateKey] ) makes
sure we include the dates that make up 2019 week 1: { 2019-01-01, 2019-01-02, 2019-01-03 }.
This measure "works" for the column chart visual, because there's nowhere in that visual to see the undesired behavior at subtotal and grand total levels. Despite this apparent functioning, the same exact thing is happening. If buggy code runs in the forest and no one is there to hear it....
Resolution, happiness, data modeling
The keen observer, or anyone who has ever had the misfortune of being around me when data modeling comes up and has heard me repeat ad nauseum that business questions must inform the model design, will have noticed that I have continuously talked about including only weeks after the first week of 2019, but that the filter logic for this is defined upon 'Calendar'[DateKey]. It should always annoy you if there are seemingly important concepts that aren't reified into the data model.
A solution to this specific challenge is trivial once we understand both how correlated slices are merged into one filter context and that our logical filtering is at the week level. We cannot achieve the filtering we want in the model as presented, but we can make a small addition to enable this. We will add 'Calendar'[YearWeek] and define a filter on that.
For expedience, I will offer a definition of 'Calendar'[YearWeek] as a DAX calculated column, but would advise that this be added closer to the source in any real model, at least in Power Query if not back into the database.
//column'Calendar'[YearWeek] = 'Calendar'[Year] * 100 + 'Calendar'[Week]
Now, we can define the visual level filter as 'Calendar'[YearWeek] > 201901 and remove the filter on 'Calendar'[DateKey]. Additionally we
can redefine [AllSales] as we said it should have been up above.
AllSales =CALCULATE (SUM ( 'FactSales'[Sales] ),ALL ( 'Calendar'[Holiday] ))
The new query is excerpted below. This seems logically equivalent, as we have defined an alternative visual level filter to give us the idea of "include only weeks after the first week of 2019." This is not equivalent, though, as we will see.
DEFINE// here is the only code differenceVAR __DS0FilterTable =FILTER (KEEPFILTERS ( VALUES ( 'Calendar'[YearWeek] ) ),'Calendar'[YearWeek] > 201901)VAR __DS0FilterTable2 =TREATAS ( { FALSE, BLANK () }, 'Calendar'[Holiday] )VAR __DS0Core =SUMMARIZECOLUMNS (ROLLUPADDISSUBTOTAL ('Calendar'[Year], "IsGrandTotalRowTotal",'Calendar'[Week], "IsDM1Total"),__DS0FilterTable,__DS0FilterTable2,"Sales_Amount", 'FactSales'[Sales Amount],"All_Sales", 'FactSales'[All Sales])...
Based on the filter context above, the measure works just fine in the report visuals. So, what's the difference between the following two scenarios:
- Filter on 'Calendar'[Holiday] and 'Calendar'[DateKey]
- Filter on 'Calendar'[Holiday] and 'Calendar'[YearWeek]
We covered number 1 extensively already. So let's walk through the
slices for the second. This is based on the visual filters for
'Calendar'[Holiday] = FALSE and 'Calendar'[YearWeek] > 201901.
- 'Calendar'[Holiday]:
{ FALSE } - 'Calendar'[YearWeek]:
{ 201902, 202001, 202002 }
What happens when we merge these to present a single filter context in
SUMMARIZECOLUMNS? Again, we can present this best as a table.
| 'Calendar'[Holiday] | 'Calendar'[YearWeek] |
|---|---|
| FALSE | 201902 |
| FALSE | 202001 |
| FALSE | 202002 |
The first week of 2020, 'Calendar'[YearWeek] = 202001, contains both
holiday and non-holiday dates. Since it is correlated with
'Calendar'[Holiday] = FALSE, it remains in context here. When we
evaluate our updated [AllSales], we include all values of
'Calendar'[Holiday] with the ALL ( 'Calendar'[Holiday] ). Thus, the
filter context within which the SUM ( 'FactSales'[Sales] ) is
evaluated is based on 'Calendar'[YearWeek]: { 201902, 202001, 202002 }. This is exactly what we want.
Note, this hasn't changed the behavior of the Tabular engine in any way. 'Calendar'[Holiday] and 'Calendar'[YearWeek] are at different grains. If there existed a full calendar week that consisted of only holidays, we would see the same behavior as above; merging the slices on 'Calendar'[Holiday] and 'Calendar'[YearWeek] would explicitly not include that week.
Conclusion
The critical point is this: DAX filter contexts are literally sets of values from a column. The emphasis is important. I spent far longer than I expected in answering this question, and my initial gut feel for the answer, while ultimately correct, was not enough for me to provide an explanation or a solution. It took me longer than I care to admit to eventually fall back to mapping out the slices and tables of filter context.
This was a really good question, and was incredibly well asked. I strongly recommend reading the Stack Overflow question to get a feel for how to ask effective questions.
Many thanks to my test readers, Brent, Darren, and Kristen. Any mistakes you see are my own. If you have any questions, feel free to get in touch.
Extra Notes
Differences with CALCULATE
CALCULATE does not merge correlated slices. Darren
Gosbell of DAX
Studio provided the query below to demonstrate
this. The first value in the resultset uses SUMMARIZECOLUMNS as we
have seen above and returns the undesired total of 600. The second
value is the result of CALCULATE ( [AllSales], __DS0FilterTable, __DS0FilterTable2 ).
DEFINEMEASURE FactSales[AllSales] =CALCULATE (SUM ( FactSales[Sales] ),ALL ( 'Calendar'[Holiday] ))VAR __DS0FilterTable =FILTER (KEEPFILTERS ( VALUES ( 'Calendar'[DateKey] ) ),'Calendar'[DateKey] >= DATE ( 2019, 1, 4 ))VAR __DS0FilterTable2 =TREATAS ( { FALSE, BLANK () }, 'Calendar'[Holiday] )EVALUATE{( SUMMARIZECOLUMNS (__DS0FilterTable,__DS0FilterTable2,"AllSales", IGNORE ( 'FactSales'[AllSales] )), CALCULATE ( [AllSales], __DS0FilterTable, __DS0FilterTable2 ) )}
This is also apparent in other client tools. Darren also pointed out
that an equivalent pivot table works just fine in Excel, so we can
conclude that it is not using SUMMARIZECOLUMNS behind the
scenes. This should be an obvious conclusion, because we know that
Excel pivot tables generate MDX queries, rather than DAX.
Phrasing
I have strived (striven?) to use the positive terminology of "sets of
included values" for filter contexts and slices throughout this
post. I hope it has not made any sentences too awkward. In general, I
prefer to use negative phrasing for filtering, and often see this in
conversations among other DAXters: "use ALL to clear the context on
that column", "exclude these values with FILTER", "filter out those
values in a CALCULATE", and so on abound. I see no harm in the
negative phrasing, but it is important to keep in mind that these are
shorthands for discussing slices of included values.
Rule-based slices
Keep in mind that logical predicates, e.g 'Calendar'[DateKey] > 2019-01-03 still result in slices of literal included values. This is
just an easier way to represent such a slice, compared to individually
and explicitly selecting each of the dates that meet the criterion. We
define a rule, or a predicate, which is evaluated for each value in
sequence. We create a slice of those values for which the predicate is
true.
ALL as a slice
ALL does not necessarily return a slice. That is, it does not always
return a set of values or a table. But you can nearly universally
treat it as if it does; it does return a table when used in an
expression where a table is necessary, e.g. in the first argument to a
FILTER. The special behavior is when it is being used as a setfilter
argument to CALCULATE or CALCULATETABLE. If you want a very good
overview of this sort of behavior, go read The Logic behind the Magic
of DAX Cross Table
Filtering.